Iterative Closest Point を試してみた
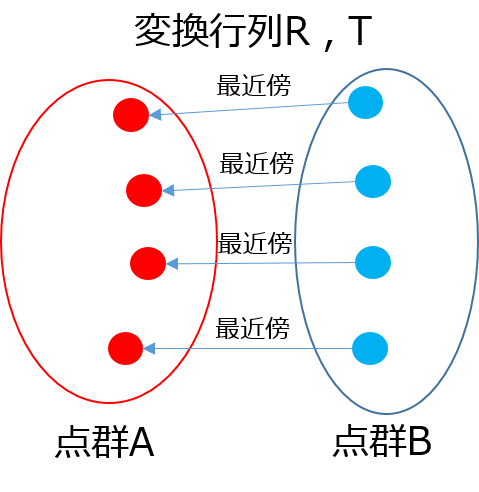
今回はIterative Closest Point(ICP)アルゴリズムを試してみました.ICPは点群Aと点群Bが与えられた際に点群Bを回転と平行移動させて点群Aに位置合わせするためのアルゴリズムだそうです。
具体的なアルゴリズムは以下の通り。
- 点群Bの各点について点群Aの中から最近傍の点を見つける。
- 点群Bの各点とAの各点が対応しているので、各対応点に移るような変換行列を計算する。
- 変換行列を使ってBを写像する。
- 指定回数分もしくは収束するまで以上の処理を繰り返す。

ソースコード
各ステップでの回転行列と平行移動行列の計算は以下のコードで計算しました.コードの詳細は以下のサイトを参照のこと.Finding optimal rotation and translation between corresponding 3D points | Nghia Ho
def calcRigidTranformation(MatA, MatB):
    A, B = copy(MatA), copy(MatB)

    centroid_A = mean(A, axis=0)
    centroid_B = mean(B, axis=0)

    A -= centroid_A
    B -= centroid_B

    H = dot(A.T, B)
    U, S, V = linalg.svd(H)
    R = dot(V.T, U.T)
    T = dot(-R, centroid_A) + centroid_B

    return R, T
ICPのコードはこちら
from scipy.spatial import KDTree
import numpy as np
from math import sin, cos

class ICP(object):
    def __init__(self, pointsA, pointsB):
        self.pointsA = pointsA
        self.pointsB = pointsB
        self.kdtree = KDTree(self.pointsA)

    def calculate(self, iter):
        old_points = np.copy(self.pointsB)
        new_points = np.copy(self.pointsB)

        for i in range(iter):
            neighbor_idx = self.kdtree.query(old_points)[1]
            targets = self.pointsA[neighbor_idx]
            R, T = calcRigidTranformation(old_points, targets)
            new_points = np.dot(R, old_points.T).T + T

            if  np.sum(np.abs(old_points - new_points)) < 0.000000001:
                break

            old_points = np.copy(new_points)

        return new_points

def icp_test():
    Y, X = np.mgrid[0:100:5, 0:100:5]
    Z = Y ** 2 + X ** 2
    A = np.vstack([Y.reshape(-1), X.reshape(-1), Z.reshape(-1)]).T

    R = np.array([
        [cos(50), -sin(50), 0],
        [sin(50), cos(50), 0],
        [0, 0, 1]
    ])

    T = np.array([5.0, 20.0, 10.0])
    B = np.dot(R, A.T).T + T

    icp = ICP(A, B)
    points = icp.calculate(3000)

    from matplotlib import pyplot
    from mpl_toolkits.mplot3d import Axes3D

    fig = pyplot.figure()
    ax = Axes3D(fig)

    ax.set_label("x - axis")
    ax.set_label("y - axis")
    ax.set_label("z - axis")

    ax.plot(A[:,1], A[:,0], A[:,2], "o", color="#cccccc", ms=4, mew=0.5)
    ax.plot(points[:,1], points[:,0], points[:,2], "o", color="#00cccc", ms=4, mew=0.5)
    ax.plot(B[:,0], B[:,1], B[:,2], "o", color="#ff0000", ms=4, mew=0.5)

    pyplot.show()

icp_test()
出力結果


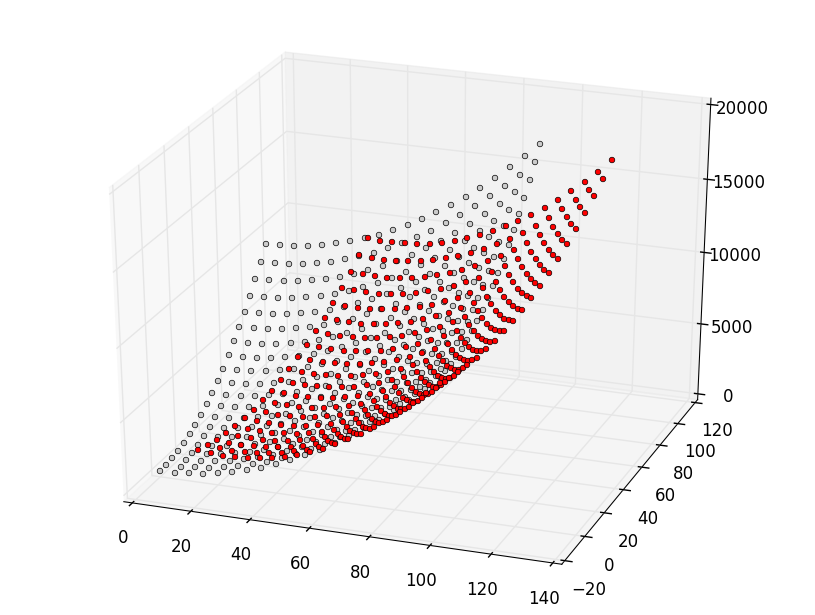
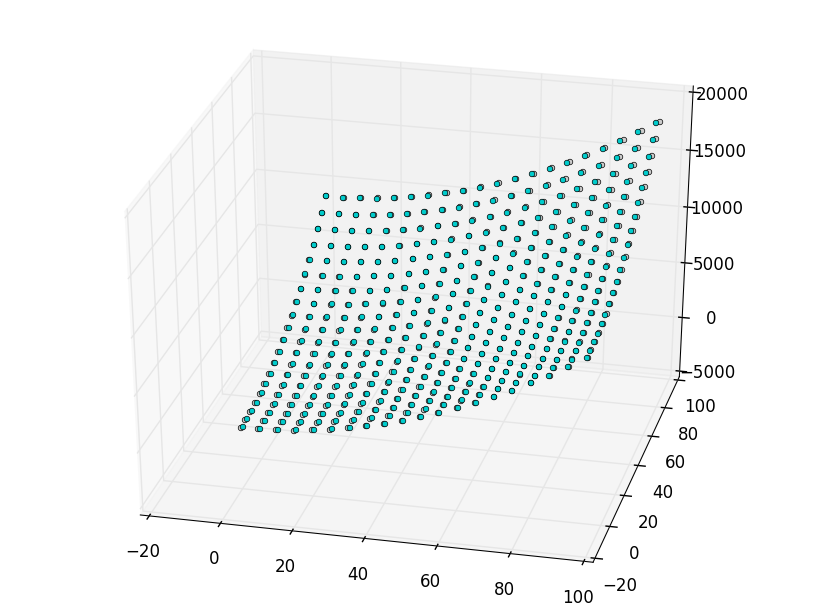
灰色の点が元々の点群Aで,赤いのがそれを変換した点群Bです.黄緑色の点はBをAに位置合わせしたもので,ちゃんと重なっていることが分かります.